Polyurethane Technical Properties
Common Urethane Parts Specifications
Most urethanes come with a technical data sheet that lists numerous physical properties designed to help the processor and the end-user select the material that best fits their application needs. These properties may also be used to help understand the differences between several materials or between several urethanes.
Understanding what these properties represent will better help the end-user make an informed decision when purchasing urethane products. Listed below are the five most popular physical properties found on a standard urethane products technical data sheet with an explanation of how each test is performed:
1. Hardness(ASTM D2240)
Hardness is measured using a handheld instrument called a “durometer.” This spring-loaded instrument measures the resistance of a material when the gauge is pressed against the surface of the material with uniform pressure. The more resistance that is found in a material, the higher value indicated on the durometer. The higher the value, the harder the material. (See figure #1)
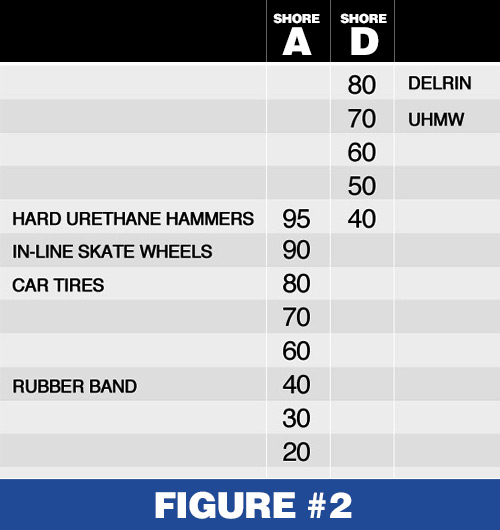
There are two different types of durometers used when testing urethanes. The first and more commonly used gauge for urethanes is called a “Shore A” durometer. The second type is a “Shore D” durometer, and it is used to measure harder materials that exceed the upper capacity of the “Shore A” gauge. Contact us for more information on urethane product technical data.

The schematic to the right which shows the overlap of the two gauges and typical real-world examples of products that often have these durometer readings. (See figure #2)
The hardness of a urethane product has a direct correlation to the remaining properties below. Generally speaking, this means that as long as the hardness of a material is within ASTM specifications of +/- 5pts, the other physical properties will also be within specifications. The hardness is also the easiest and least costly measurement for a processor to take. For these reasons, it is common for the hardness to be used in an inspection routine to determine a pass or fail while the remaining measurements on other physical properties are not taken to confirm acceptance of a finished urethane part.
2. Tensile(ASTM D412)
Tensile measures the maximum strength of the urethane product. For this test, a dumbbell-shaped piece is cut from a sheet of urethane that typically measures .080″ thick. This dumbbell is pulled by a machine that measures the pulling force or stress, which is measured in pounds per square inch (PSI). The dumbbell is pulled and tension increased to a point where the material breaks. At this point, the force is measured and the value of the necessary force to break the material is the tensile strength. (See figure #3)

3. Modulus(ASTM D412)
Modulus uses the same test as the tensile test, and the same dumbbell sample is prepared in the same way. However, under this test, the sample is stretched to a predetermined percent larger than the original size of the dumbbell. Most of the time the sample is stretched so that it is 100 percent, 200 percent, or 300 percent larger than original. At each one of these sizes, the force needed to stretch the sample is measured in PSI. A measurement of the force at 100 percent is referred to as “100% modulus”. (See figure #4)

4. Elongation(ASTM D412)
Elongation also uses the same test as tensile and modulus. However, elongation is a length measurement of the dumbbell sample at the time of it breaking (at the same time tensile occurs). This measurement is represented by a percentage value. If the dumbbell measures 1 inch and it is then stretched to 8.32 inches and breaks, then the sample has an elongation of 732 percent (8.32 inches minus 1 inch). (See figure #5)

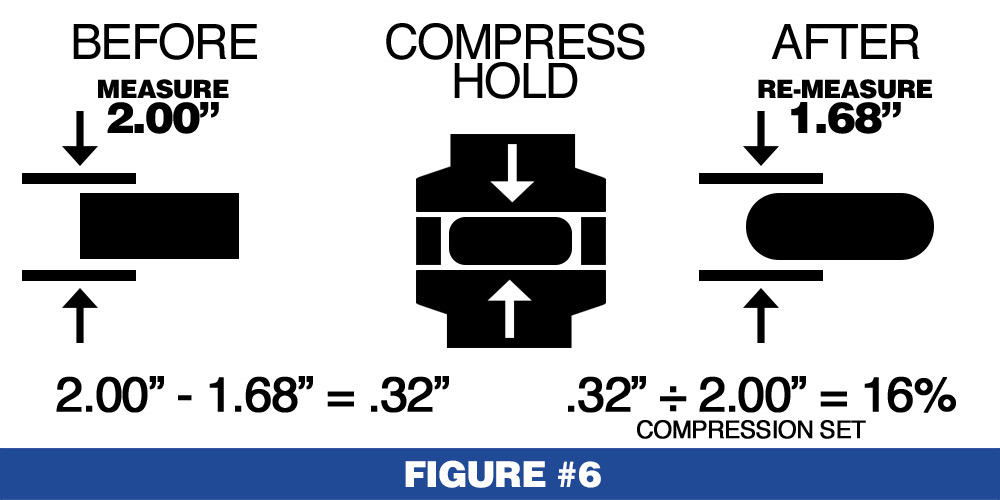
5. Compression Set (ASTM D395)
Under this test, a specimen of urethane material is put under a compressive load to decrease the material’s thickness to a predetermined measurement. The specimen is held at this compressed thickness for a certain period of time and temperature. After this period, the sample is released from compression. The thickness is then measured and compared to the original thickness. The loss in thickness is given in a percentage value. (See figure #6)